Thursday, February 1, 2018

Feb. 1 Momentum Ranks and Day 1 of Implementation of the Portfolio

I created an investagrams account to be able to use their virtual portfolio because they include the commission charges and all other transactional fees. If this is the first time you are reading about this momentum rotation strategy, kindly read this first post about it.

Before I give you today's momentum rank I wanted to show you the results of our 1st day.
Here's the momentum rank from yesterday:

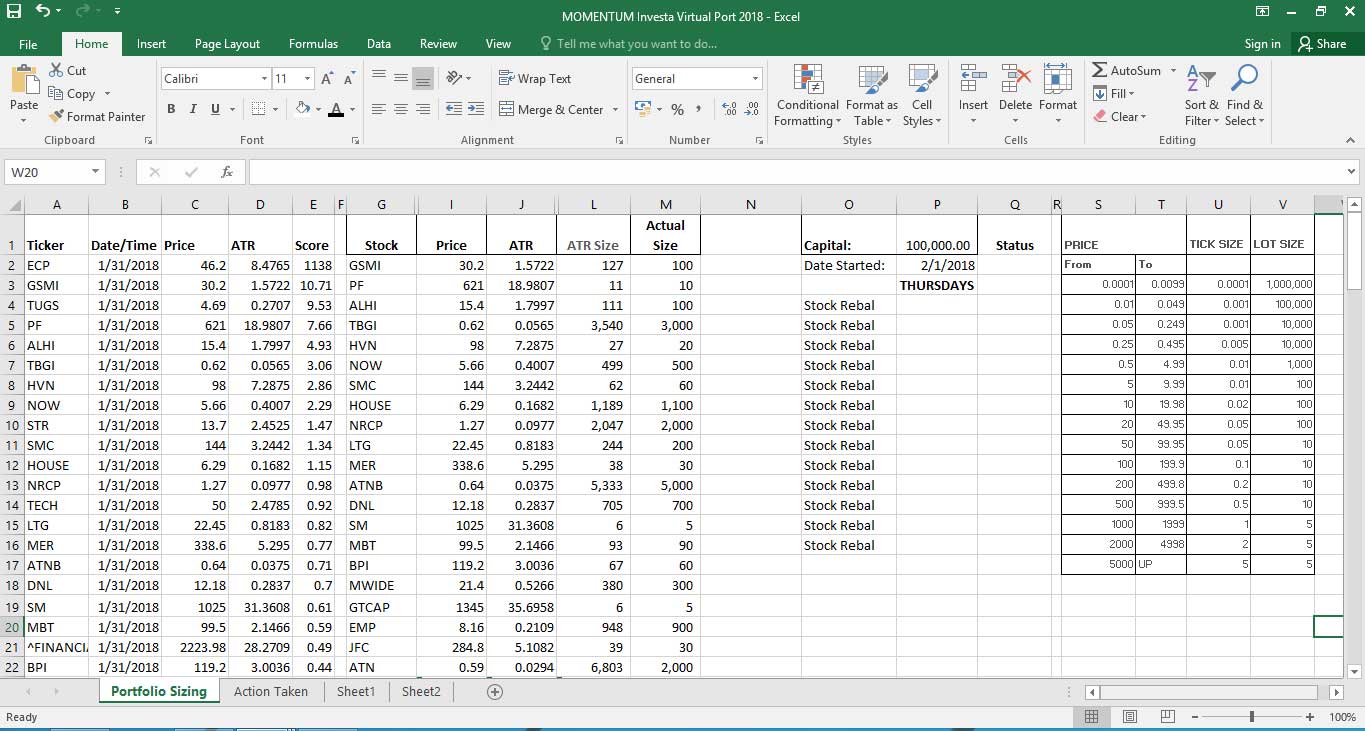
I have a template already made (let me know if you want a copy) that helps me determine the number of shares I need to buy for my position sizing. It looks like this:


After buying from the top (except for those whose ATR sizes do not fit into minimum boardlots) all the way down until my 100k virtual capital ran out, here are day 1's results. Please keep in mind the following:

  1. NO THOUGHT WAS GIVEN TO ENTRY PRICE. I just bought right away at the market open.
  2. Aside from checking whether the Index was above SMA 200 or not, I did not check the charts of the stocks I bought.
Here were the stocks after buying this morning:

And here it is after End-Of-Day Feb. 1, 2018. 

So the next time I'll post an update about this virtual port will be next Thursday, since we will only be checking the port once a week and see if any of our holdings have been removed from the momentum ranks.

As promised, here are the Momentum Ranks for End-Of-Day Feb. 1, 2018.

Caveat and God bless!

Wednesday, January 31, 2018

How to implement a Systematic Portfolio Trading Strategy thru Momentum

Majority of the traders I see on Facebook and FB groups are discretionary. I am not saying that they are bad when in fact some of them became millionaires by doing what they do. I've wanted to be like them, however, my day job simply doesn't allow me to be in front of the computer 90% of the time because my work is in the field. Also, having gotten married last year, my responsibilities and need for a steady income doesn't allow me the luxury of being a trader.

Although my portfolio did not suffer, since I practiced trail stops and cut loss, I wasn't able to enter into price levels that I wanted to, nor be able to catch breakouts at optimum price levels. I needed a system that would allow me to trade once a week and still be able to match or have a larger probability of beating the market...

I began my search for a trading system that allowed me to do the following:

  1. Execute trades once a week. With the increase in tax for transactions in the PSE, I didn't want to dance in and out of stocks a lot.
  2. Since I'm not able to enter breakouts at optimum price levels, I want the system to be forgiving in such that price entry becomes a minimal factor, if none at all.
  3. I want to buy stocks that have great momentum and be able to find the next multi-bagger stocks such as MAC (+630%) or IMI (+302%).
  4. I do not want stocks that are too volatile. The higher the volatility, the less shares I will buy.
  5. I wanted a rigid-set schedule for my "PSE Trading/ Investing" time.
  6. I wanted to make money.
My search led me to systematic trading strategies wherein Quantitative Analysis is used. I didn't have time to read financial statements nor have the patience for it. Trying to make buddy-buddy with "gurus" that had insider info was a waste of time since most of their secret info turned out to be duds, and focusing on price yielded similar results anyway. 

I needed a system based on cold hard numbers, and I believe I have found that. The system is linear regression-based to calculate and rank the momentum of stocks. The higher the momentum, the higher its priority to buy. 

The caveat here is that top ranked stocks might be nearing their peak. This is why we will trade and examine results through the entire portfolio and not individual stocks. If one stock is down, the gainers of the portfolio carry the slack, and until the system tells us to sell the laggard, it still has a 70% probability of rebounding and continuing its uptrend.

Getting to the point, this is what the ranking looks like:

You have your choice of how to allocate your portfolio if you want only blue chips, All Shares, or a mix of the 2. If you go for the mix, you can allocate half your capital to blue chips, and the 2nd half to the All Shares list.

I went with All Shares.

The rules are as follows:
1.) Pick a day on when you want to perform your transactions. I chose Monday so I can do my position sizing (more on this in no. 4) on Sunday.

2.) Check if the PSE Index is above Simple Moving Average 200. This is how we stay out of downtrends and stay in uptrends. If the PSEi is below SMA 200, NO BUYING!

3.) Buy from the top of the list until you run out of capital.

4.) Volatility affects the position. The higher a stock's volatility, the less we buy of it. That's how we will size our positions, by using the Average True Range (ATR) on a 20 period setting. The number of shares you buy will be as follows:
  • Number of shares = (Capital * Risk Factor) / ATR
  • Where Risk Factor:
    • 0.001 = Low Risk Appetite
    • 0.002 = Moderately Low Risk Appetite
    • 0.003 = Moderate Risk Appetite
    • 0.004 = High Risk Appetite
    • 0.005 = Very High Risk Appetite
  • Example: I want my risk factor to be 0.002. My capital is 100,000. So the number of ECP shares I should buy is: (100,000 * 0.002) / 8.4765 = 23.59 shares. ECP's price is Php 46.8 so minimum boardlot is 100. Since the boardlot is greater than the recommended ATR shares, I move to the next stock, GSMI. GSMI shares = (100,000 * 0.002) / 1.5722 = 127.21 shares. Boardlot for GSMI is 100, so I buy 100 GSMI shares.
  • Choose only ONE risk factor for the ENTIRE portfolio. Otherwise, you will be burdened by trying to remember the different risk factors you used on different stocks.
5.) Sell if the stock is no longer in the list. 

6.) Sell if the stock goes below Simple Moving Average 100 (SMA100). This would usually mean removal of the stock from the list since stocks below the SMA 100 have lost their momentum. The SMA 100 is also one of our determining parameters for the system. You can change this to SMA 50 if you want tighter stops.

7.) If the Index moves below SMA 200, we stop buying and wait until the stocks in our portfolio are stopped out.

8.) We follow a hard stop loss of 10%. If a position goes -10% or more, we sell it no matter what.

And there you have it. A nice and tidy systematic portfolio trading system based on momentum. I will set up a virtual account in investagrams with an initial capital of 50,000. I will post the results of the system here as well as the buy and sell transactions performed.

I'll also be posting the momentum ranks once a week, so be sure to check in every now and then.

Also, I will be making a new post about how to go implementing a momentum rank portfolio system for yourself in a new post.

Feel free to post a question below and add me in Facebook or Twitter. I also put up a Facebook Group should you have any questions.

Implementing the system can be found in this post: https://goo.gl/aAWFis

Caveat and God Bless!


Wednesday, April 6, 2016

EW - sleeper update 2

So our sleeping East West finally took off. Yesterday's candle closed at 15.98 with a high of 16.30. I hope you accumulated this in the 15.24 area, because psychologically, the downturn wouldn't scare you.

We began our vigil for East West here: East West Sleeper Play
And the first update can be found here: EW sleeper update 1

Immediate support should be at 15.35. RSI 30 shows EW attempting to breach 50 but wasn't successful. Expect the stock to go down abit further possibly to the 15.58 which is the 61.8% fibonacci retracement level. Check the image below. (click to enlarge)


Sell or hold, it is up to you. If it begins to go below 15.58, then sell to lock in your profit. Please note that price during the IPO was in the 20 peso level. Congratulations if you've made it this far!

Caveat and God bless your investments!


Tuesday, March 22, 2016

EW: sleeper update 1

We've seen that East West Bank fluctuate. Fortunately the fluctuations have been mild. Also, because of the $81 million money stolen from Bangladesh, EW was affected due to two of the accused as being former employees of East West Bank (Maia Santos-Dequito, and Allan Penalosa). This likely affected the stocks performance (through market psychology), and potential buyers stayed away.

Here is an article today wherein EW Exec reaffirmed his statement issued during the senate hearing that his bank did not have any transaction linked to any violation of the Anti-Money Laundering Act (AMLA).

You can find the full article here: Don't drag us into your mess, RCBC told 

Let's check EW's chart. (click on the photo to enlarge)

The red mark-down arrow is when the two accused were mentioned as former employees of EW (the day Enrile wanted to cite Deguito in contempt). After that small dive, price action has moved along the upward trend line. 

There was resistance at 15.28, but now it has become support. Move stop loss from 15.02 to 15.14.

For now, refrain from adding into your stock positions. If you can, add this to your watchlist and buy only when 15.40 resistance has been broken (i.e. buy at 15.42 when price action increases with good volume).

We are in no rush. Just sit and wait and follow the trading plan.

Caveat and God bless!


Friday, March 18, 2016

FLI: sleeper update 3

Here are the last posts, in order, about FLI:
Our first sleeper pick traded at the close of 1.75, with a high of 1.80. Today's candle shows a long wick which accounts for nearly 25% of the candle. This means that buyers/ bulls tried to drive the price up to 1.8, but there were more sellers at that level and the sellers/ bears drove the price back down to 1.75. (click on photos to enlarge)

Will price go down? Let's look at the stock's history: 

Resistance area closer to recent price:

If you notice on the photo above, I use RSI 30. I feel more comfortable with this setting than RSI 14. I learned this from Spyfrat and how it can be a powerful tool aside from just determining overbought and oversold areas. Here's a link to his blog: Spyfrat's Call

RSI 14 vs RSI 30. It's all a matter of personal preference.

FLI will likely go down tomorrow. Keep an eye on price action while it declines and see if it bounces off of the 23.6%, or 38.2% fibonacci retracement levels.


Retracement to price are as follows:
23.6% retacement = 1.70
38.2% retracement = 1.65 
Or you can use today's low as your stop loss (1.66). If it falls below that, then CUT to preserve profits.

Will write an article for EW soon, so keep an eye out for that, or subscribe to this blog (Its free!) so you can be notified via email once I make a new post. 


Caveat and God bless!


Sunday, March 13, 2016

Sleeper Play: East West Bank (EW)

I'm happy to report that FLI is now at 1.69. I'm not too happy about the steep incline and would have preferred it rise gradually. Steep inclines usually means quick exhaustion. You can use EMA 10/20 along with Parabolic SAR and Stochastics to Monitor price movement and lock in profits when you can. Or you can lock in profit already and then buy back after reversal has exhausted.
(click on the photo to enlarge)


I was about to suggest 2GO as our next sleeper play, however it has already surged up. Check the picture below. (click on the photo to enlarge)


Now, let's focus on East West Bank (EW), FLI's banking arm.
Here are the fundamentals as of Sep. 30, 2015 (3Q 2015). They have yet to release their 2015 annual report.


Although net income has slightly declined, the stock is trading near its all-time low. See the monthly chart below. (click on the photo to enlarge)


Below is EW's daily chart. (click on photo to enlarge)


You can do a test buy for now, and add more when price action breaches 61.8% fib level (or 15.79) ala Nicholas Darvas style.

Please note that the company has yet to release its 4th quarter earnings result. Lower earnings might bring the stock lower. Also, the company's Chairman Emeritus, Mr. Andrew L. Gotianun, Sr., recently passed away (rest in peace)...so it might be wise to wait until Tuesday to see how this affects the stock price before doing a spot entry.

Stop loss is set at 15.02. If price action violates this level, then SELL IT IMMEDIATELY.

Caveat and God bless!


Wednesday, March 9, 2016

FLI: sleeper play update 2 - Breakout!!! Now at 1.63!!!

Our patience is beginning to pay off. We first began our vigil on FLI with this first post on Feb. 18, 2016: FLI: sleeper?

Below is the screen shot when I initiated my buy. (click photo to enlarge)

Here is the next photo from the last update on Feb. 24, 2016: FLI: sleeper update
(click on the photo to enlarge)


And here we are today. (click on the photo to enlarge)

If you didn't listen to my warnings and bought anyway, then congratulations! Hehe!

I usually use EMA 15/30 or EMA 10/20, depending on the stock. Each stock is unique so there isn't a once size that fits all of them.

I also put heavier reliance on RSI versus stochastics due to preference. RSI tends to be more accurate or clear for me when divergences occur.

What now? Monitor the EMAs. If the slower EMA begins to cross over or is crossing over the faster EMA, then sell. Simple as that. If the stock continues to go up, then you might consider adding a few more shares especially if it breaches the 38.2% fibonacci level with strength and volume.

Since this has already broken out, I am now looking for the next "sleeper play".

2GO looks promising.

Caveat and God bless!